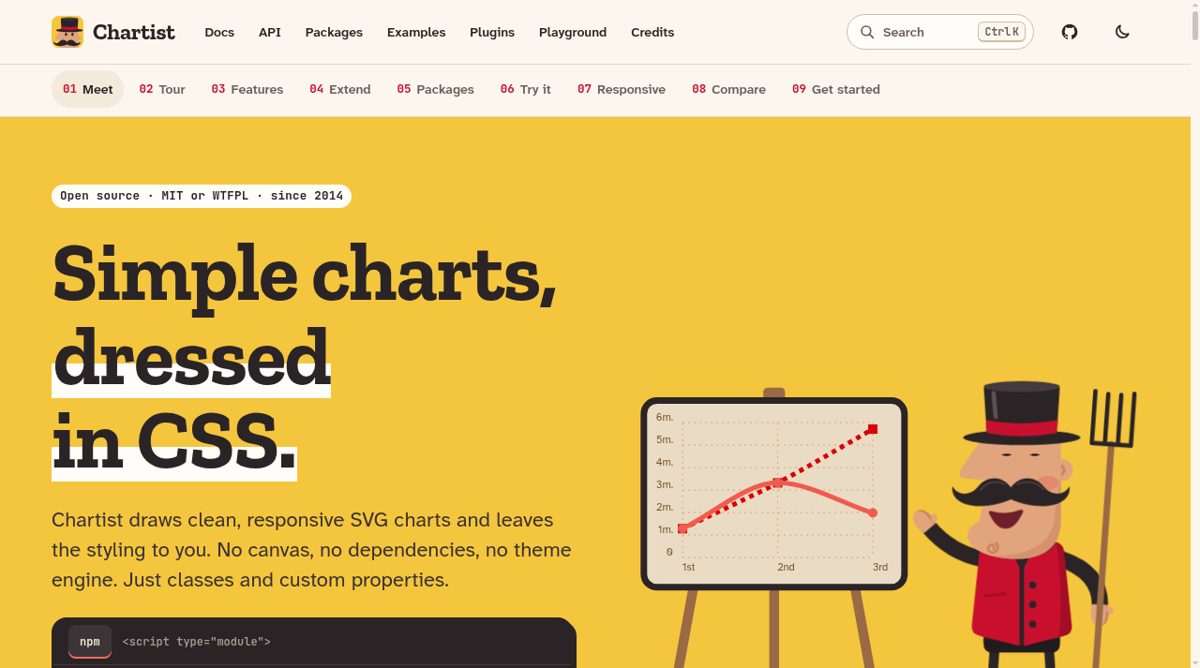
Chartist is an open-source JavaScript charting library that renders charts as SVG and gives styling control to CSS. Developers supply a container, data and options, then use classes and custom properties to change how the chart looks. The current documentation shows line, area, scatter, bar, pie, donut and gauge examples, along with a composition API for combining bars and lines with separate axes. It is aimed at developers who want chart output that fits the styling of an existing web interface.
The library offers a typed functional API, native ES-module use and a rendering pipeline that plugins can extend. Its current site also documents rendering a chart scene to an SVG string for server-side uses. Responsive options can depend on window conditions; container-based conditions are explicitly described as experimental and currently require a polyfill. That distinction matters when choosing a technique for reusable dashboard cards. The site demonstrates editable examples so developers can compare changes to data and styling directly.
Additional packages cover tooltips, common extra chart layers and terminal or text-art output. These are separate packages rather than a promise that every interaction ships in the smallest core import. Community wrappers exist for several frameworks, but the documentation labels them by the Chartist API generation they target, so wrapper compatibility should be checked before adoption. Chartist is offered under MIT or WTFPL licensing. Its strongest fit is an SVG-and-CSS workflow; teams seeking a much larger built-in chart catalog or ready-made zoom behavior should evaluate the relevant plugin and integration requirements.