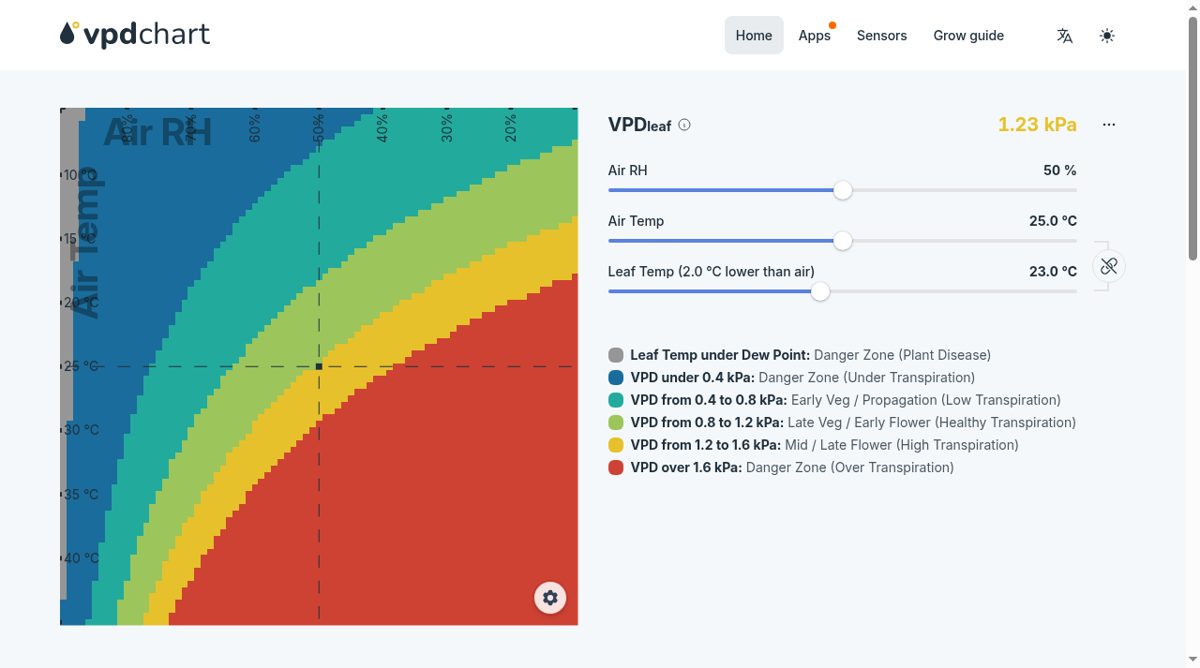
VPD Chart is an interactive chart and calculator for exploring leaf vapor pressure deficit. The public tool combines air relative humidity, air temperature and leaf temperature, then displays a calculated value in kilopascals alongside a color-coded chart. It is aimed at people comparing environmental conditions for plant growing, with a visual interface that makes the relationship between these inputs easier to inspect.
Users can move sliders or select a chart cell to change air conditions, set the leaf temperature separately and link the two temperature values to preserve their difference. Dashed lines locate the selected conditions on the chart. The interface includes a legend with ranges for different growing stages and warnings for conditions it classifies as too low, too high or below the dew point. Chart settings also provide crop and temperature-unit choices.
The published instructions describe setting a target by right-clicking a cell or holding it on a phone, then using the tool to explore how to reach that target. These controls make it useful for comparing scenarios rather than reading a single static lookup table. The result still depends on the supplied measurements, and the chart is not a substitute for checking the needs of a particular crop or growing system. VPD Chart is best understood as a focused planning and reference tool for seeing how temperature and humidity changes affect a calculated plant-environment metric.